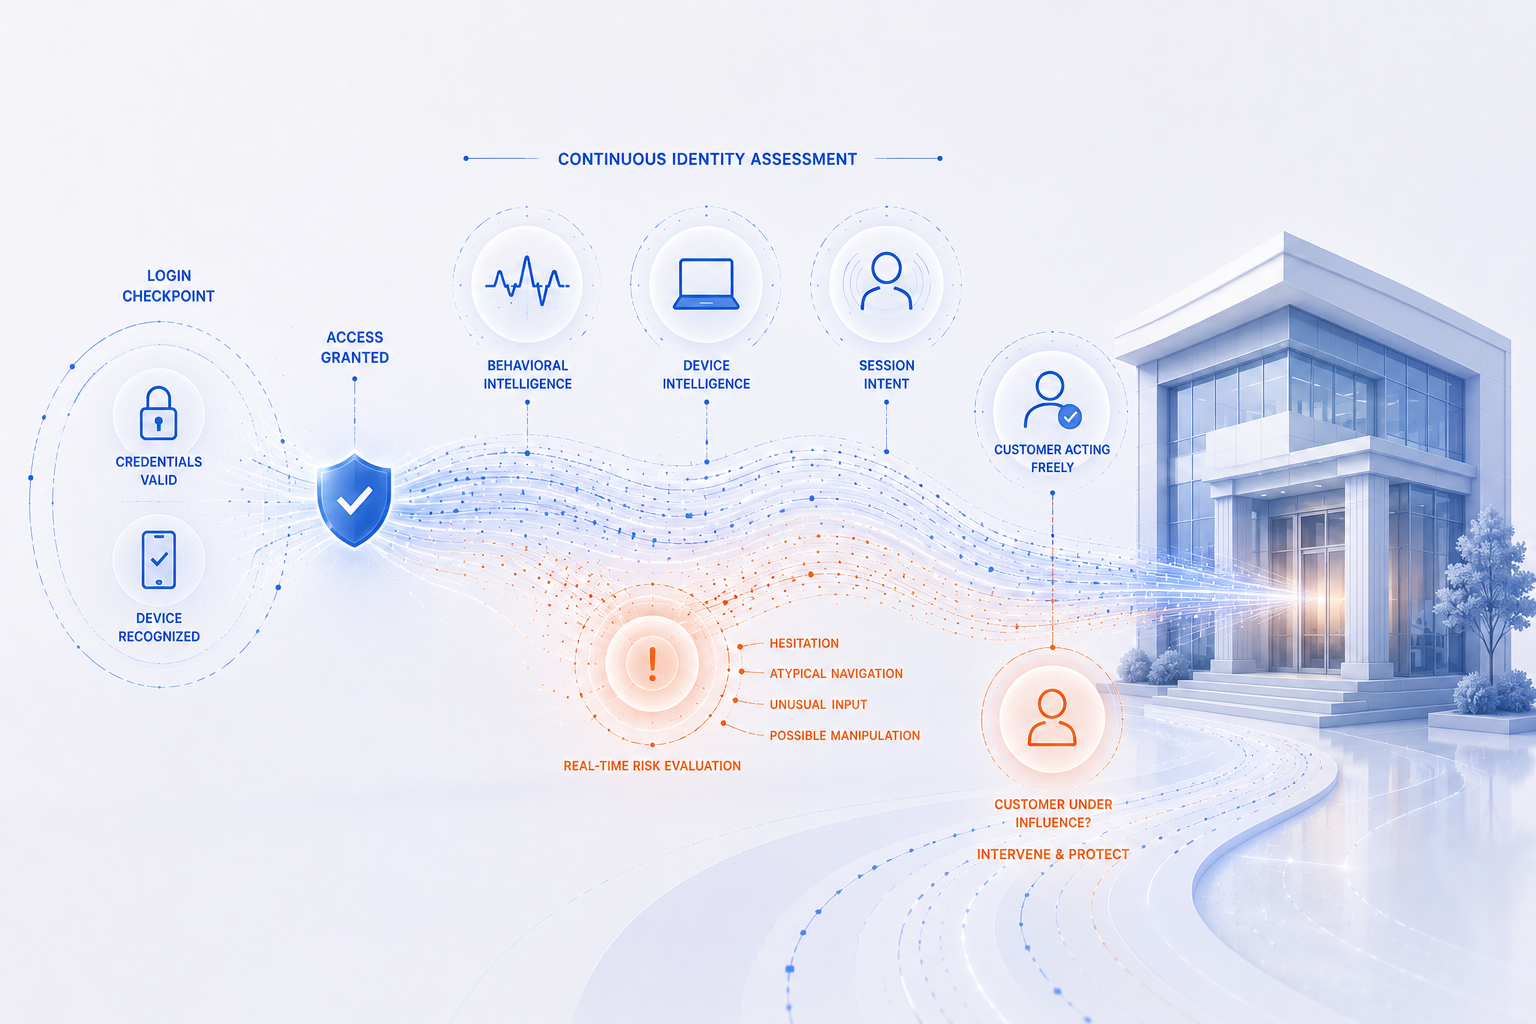

There are three numbers that appear in virtually every large bank’s presentation to their board of directors, every piece of investor communication, and every regulatory filing:
- The efficiency ratio
- Return on tangible common equity (ROTCE)
- The common equity Tier 1 ratio (CET1)
Each is shaped, invisibly, by fraud architecture decisions made far below the board level.
The efficiency ratio
If you are a CFO with an efficiency ratio sitting at 62%, you have a list of initiatives to improve it: technology modernization, headcount rationalization, revenue growth, etc. What almost certainly isn’t on that list and should be: a rethinking of the bank’s existing fraud architecture.
A fragmented fraud stack is a structural drag on both sides of the calculation.
- On the expense side: three to five vendor contracts, integration overhead, manual review headcount, and model retraining fees.
- On the revenue side: genuine customers declined because the decisioning system lacked confidence, applications abandoned in friction-heavy flows, relationships that never activated.
Every basis point of efficiency ratio improvement compounds year over year. A 100-basis point improvement is the outcome of improved financial architecture, but it’s on fraud teams where the work that makes that improvement possible occurs.
Return on tangible common equity (ROTCE)
JPMorgan committed to 17% ROTCE through the business cycle. Wells Fargo and Bank of America both set medium-term targets of 17–18%. The gap between current performance and those targets is closed through net income improvement and capital efficiency, which is exactly what fraud architecture impacts.
Every fraud loss prevented flows to net income. Every dollar of operational cost removed does the same. A cleaner portfolio means lower charge-offs, lower provisions, stronger retained earnings. All of these things improve the ROTCE numerator without requiring additional equity capital.
Common equity Tier 1 ratio (CET1)
Under Basel III’s operational risk framework, fraud losses directly increase risk-weighted assets (the denominator of the CET1 calculation). A bank with $500 million in annual fraud losses carries risk-weighted-assets (RWA) pressure that requires incremental equity capital to maintain regulatory ratios.
Better behavioral detection reduces fraud losses, which reduces operational risk RWA, which raises the CET1 ratio. That’s capital efficiency. Every basis point of CET1 headroom created through better fraud architecture is a basis point freed for shareholder returns, acquisitions, or growth investments.
The full cost of fragmentation
Most major retail banks run three to five separate vendor relationships. Each requires an integration project of three to six months. That’s 12 to 30 months of development capacity consumed before the stack is operational. During that time, the bank is exposed to fraud that its incomplete stack cannot detect.
Model retraining is a billable event. New attack patterns require change orders. The governance cost to every model in production — monitoring, validation, documentation, regulatory readiness — is multiplied by the number of models. And the cost that almost never appears in any spreadsheet: the fraud a fragmented stack misses because its signals were siloed.
The math over five years
The institutions that have done this math honestly — counting integration overhead, operational headcount, change-order cycles, and the fraud missed by a siloed stack — consistently reach the same conclusion: The premium price of a behavior-first platform is recovered within 18 months.
Consolidated platforms analyzed at scale demonstrate a measurable 76.4% average decline in fraud losses and consistent 15x ROI over the investment period.
The license fee is the smallest number in the calculation. The question is not what the platform costs. It is what the alternative is costing, every quarter, invisibly, across the income statement.
The capital allocation conversation
The fraud architecture conversation is currently happening in the wrong room. It happens between fraud teams and vendors, between CISOs and their security budgets. Those conversations are necessary but they’re insufficient.
The conversation that most banks have not yet had is the one that brings three executives into the same room: the CFO, the CRO, and the executive who owns the business lever being pulled.
If the case is centered on operational efficiency, that third seat is the CIO. If the case is centered on deposit growth, it’s the head of consumer and community banking. If the case is centered on operational risk reduction, it’s the COO.
Regardless of which executive sits in the third seat, the conversation is the same. It’s looking at efficiency ratio, ROTCE trajectory, and CET1 headroom. It’s not looking at fraud detection rates or false positive ratios.
Three questions for that room
- What is our fraud architecture actually costing us? Most boards never see more than the total sum of vendor contracts. They need to also see integrations, operations, headcount, change orders, revenue lost to friction-driven rejections, portfolio degradation from undetected mule accounts, and the operational risk capital cost of fraud losses.
- What is the compounding value of getting it right? Bank boards of directors need to see the value of a behavior-first architecture that moves the efficiency ratio, improves ROTCE through lower charge-offs, and reduces operational RWA over five years.
- Who owns the answer? In most banks, no single executive holds the full picture. Behind every efficiency ratio that won’t move is a cost structure no one has mapped. Behind every ROTCE target that slips is a net income drag no one has attributed.
The architecture conversation and the capital allocation conversation are the same conversation. Bank leaders need to be asking whether the architecture managing fraud is working for the business or against it.
—
Key takeaways:
- Fraud architecture decisions made far below the board level quietly shape the efficiency ratio, return on tangible common equity (ROTCE), and the common equity Tier 1 (CET1) ratio that every large bank reports to investors and regulators.
- A fragmented fraud stack hurts the efficiency ratio on both sides of the calculation, adding vendor, integration, and manual review costs while turning away genuine customers through declined transactions and friction-heavy flows.
- Every fraud loss a bank prevents flows directly to net income, which raises the ROTCE numerator without requiring additional equity capital.
- Under Basel III, fraud losses increase operational risk-weighted assets, so better behavioral detection raises the CET1 ratio and frees capital for shareholder returns, acquisitions, or growth.
- Banks that count integration overhead, headcount, change-order cycles, and fraud missed by siloed signals find that a behavior-first platform recovers its premium price within 18 months.
- Banks need to move the fraud architecture conversation out of the fraud team and vendor meetings and into a room with the CFO, the CRO, and the executive who owns the relevant business lever.
Resources:
- Blog: The Recognition Economy: A new framework for how banks will compete
- Blog: Fraud, cybersecurity, and AML have merged into one big problem
- Blog: IDC recognizes behavioral intelligence as most critical signal layer
- Blog: How behavioral intelligence turns deposit growth into lasting value